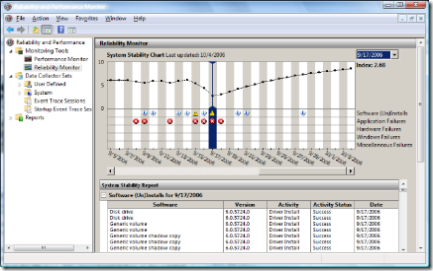
The coolest thing in it is the Reliability Monitor:
It tells you about crashes that happened in the past, applications that installed or uninstalled with failures, hardware failures, windows failures and so on, and then it compiles all that data into a nice visual to give you an impression of how stable your system is / was.
If you click on a graph point in the past, you get a report of what exactly happened on that day. In the graph above, I was playing around with getting OneNote 2007 Beta 2 TR installed after I had upgraded an Office 2007 Beta 2 install that didn’t include that particular component originally. I had lots of installer crashes and app crashes that day, and it shows in the dip in the graph.
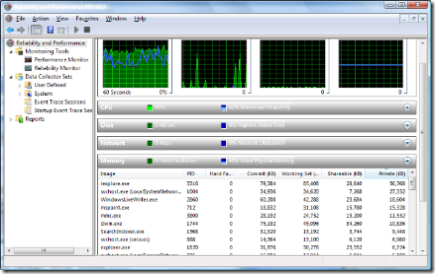
Of course, the Performance graphs are not too shabby either:
It finally includes a hard drive monitor as well, not just CPU, memory and networking!
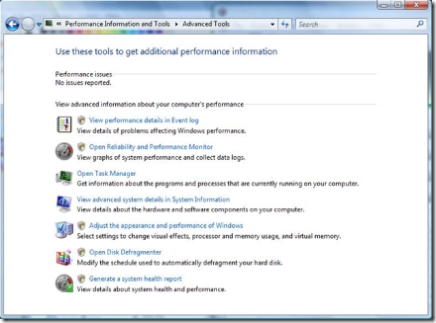
You can find it in Performance Information and Tools – Advanced Tools (or by typing “rel” into the Start Menu Search Box):


